Zhang Xiaoxia. 
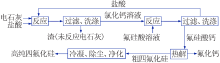
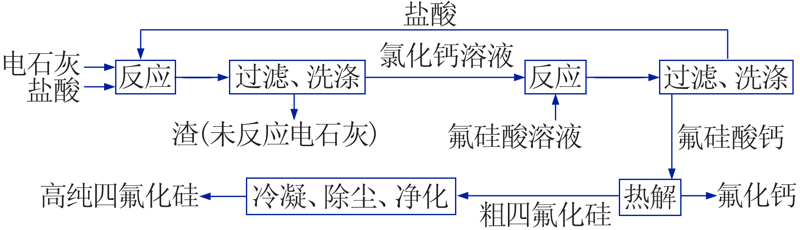
Study on preparation process of silicon tetrafluoride from fluosilicic acid and electric lime[J]. Inorganic Chemicals Industry, 2021, 53(9): 88-91.
Schematic diagram of the process flow for co-production of calcium fluoride from silicon tetrafluoride prepared by fluorosilicic acid and electric lime"
Fig.1
Table 2
Relationship between the ratio of raw materials and the content of dissolved silicon in the mother liquor"
序号
m(CaCl2):m(H2SiF6)
m(20%H2SiF6)/g
m(母液)/g
母液w(SiO2)/%
溶解性Si占比/%
1
1.2:1
503
528.5
0.95
11.98
2
1.4:1
505
536.6
0.82
10.46
3
1.6:1
505
701.5
0.49
8.17
4
2.0:1
506
688.4
0.25
4.08
5
2.3:1
504
710.8
0.23
3.89
Table 2
Fig.2
Effect of reaction temperature on the yield of calcium fluorosilicate"
Fig.2
Table 3
Effect of concentration of calcium chloride solution on yield of calcium fluorosilicate"
序号
w(CaCl2)/%
m(20%H2SiF6)/g
m(母液)/g
母液w(SiO2)/%
溶解性Si占比/%
1
45
506
732.8
0.32
5.56
2
50
506
688.4
0.25
4.08
3
55
506
656.0
0.24
3.73
4
60
506
628.3
0.18
2.68
5
62
506
618.4
0.18
2.64
Table 3
Fig.3
XRD pattern of calcium fluorosilicate"
Fig.3
Figure. 4
Calcium fluorosilicate pyrolysis temperature trend graph"
Figure. 4
Table 4
Static pyrolysis of calcium fluorosilicate in different temperature zones"
温区/℃
分解率/%
产物状态
四氟化硅粗品纯度/%
<250
<10(3 h)
松散粉状
95
250~350
90~99(1 h)
大部分松散粉状,少量结块
98
>350
100(0.5 h)
结块,轻触可破碎,微量黏壁
96
Table 4
Table 5
Comparison of product quality of silicon tetrafluoride prepared in the experiment with that of commercial products"
项目
w(SiF4)/%
w(HF)/10-6
w(N2)/10-6
w(O2)/10-6
w(CH4)/10-6
w(CO)/10-6
w(CO2)/10-6
市售产品
≥99.99
≤50
≤3
≤1
≤10
≤0.5
≤1
实验产品
≥99.99
≤2
≤3
≤1
≤2
≤0.1
≤0.5
Table 5
Table 6
Comparison of product quality of by-product calcium fluoride with industry standard indexes"